January 6, 2022
January Bulls And Bears, Tame Them With Knowledge
2021 was yet another fantastic year for returns in the stock market. That said, with recent news of the Fed ending their bond buying program and planned interest rate hikes in early 2022, we are seeing increased volatility in the stock market. Volatility is back and so are the emotions that come with it. In an attempt to control those emotions, our thought leadership piece this month is built around some market facts that are the basis for our “stay the course, this will work over time” approach.
When a market falls 10% from its peak it’s called a correction. When it falls by at least 20% it’s called a bear market. On average, there has been a market correction every year since 1900. Historically, the average correction has lasted only 54 days. It’s important to note that in the average correction over the last 100 years, the market has fallen only 13.5%. From 1980 through the end of 2015, the average drop is a little higher at 14.2%. Even more important to note is fewer than one in five corrections escalate to the point that they become a bear market. 80% of corrections don’t turn into bear markets. Corrections are a way of life; we should acknowledge them but shrug them off. The stock market rises over time despite many short-term setbacks. From 1980 through 2015, despite experiencing that annual correction, the market ended up with a positive return in 27 of those 36 years, 75% of the time!
There were 34 bear markets in the 115 years between 1900 and 2015 – on average they happened once every 3 years. More recently though, they have been less frequent. In the 70 years since 1946 there have only been 14 bear markets, so one every 5 years. Historically the S&P 500 has dropped by an average of 33% during bear markets and in over a third of those markets the drop was more than 40%. The good news is bear markets don’t last. The average lasts about a year with the shortest being 33 days (2020) and the longest being 694 days.
So, that’s the bad news, corrections and bear markets will continue to happen and with great frequency, BUT they are short lived, and markets continue to rise over time, so the prospects of winning in the market long-term are extremely high. In fact, once the bear market ends, the rewards for those who stayed in vested are huge. After bottoming out in March 2009, the S&P 500 shot up by 69.5% in just 12 months. Take a look at the graph below showing the growth in the S&P 500 over the last 30 years. There are plenty of small declines, a few big ones, but overall the trend has been increasingly upward.
Now that we know how the market behaves over time, we must focus on what we can control, not what we can’t. We can control the broad asset allocation between stocks and bonds and the tactical allocation between asset classes within those broad categories. We cannot control when the markets for each asset class will rise and fall, but we know that over time they will do both.
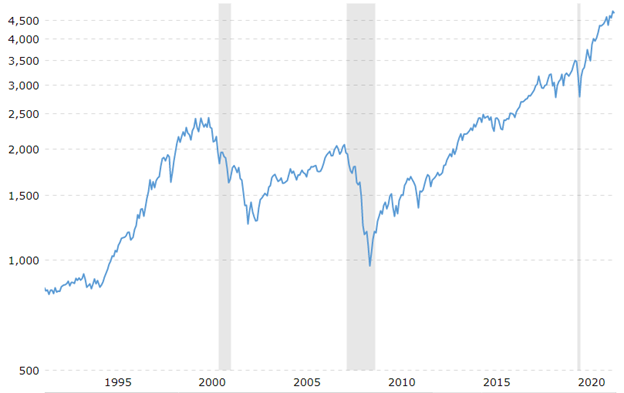
Source: https://www.macrotrends.net/2324/sp-500-historical-chart-dataNote: statistics in this article are sourced from Tony Robbins 2017 book, Unshakeable
Disclosure: Historical market performance and trends do not guarantee future results
Nick Kolbenschlag
Chief Executive Office & Co-Founder